Monitoring Plex Media Server logs using Promtail, Loki and Grafana
There are many reasons why you might want to monitor the Plex Media Server (PMS) log files. I simply want to have all logs available through a Grafana dashboard and configure some thresholds / alerts on it.
Requirements
You have already installed Loki and Grafana on a monitoring server. Also you have installed Promtail on the PMS server. Promtail collects the log files on the local server and sends it to the Loki instance. Loki stores all logs and is connected to Grafana for building beautiful dashboards.
This article does not cover how to configure those three products itself. It just handles the Plex specific part.
Configure Promtail
I use currently the following configuration:
scrape_configs:
  - job_name: plexmediaserver
    static_configs:
      - labels:
          __path__: /var/lib/plexmediaserver/Library/Application Support/Plex Media Server/Logs/Plex Media Server.log
          job: plexmediaserver
          server: myserver1
    pipeline_stages:
      - regex:
          expression: "^(?s)(?P<time>\\w+ \\d+, \\d+ \\d+:\\d+:\\d+\\.\\d+?) (?P<content>.*)$"
      - timestamp:
          source: time
          format: "Jan 02, 2006 15:04:05.000"
          location: "Europe/Berlin"
      - output:
          source: content
Static Config
__path__ is the Log File Path. This path depends on your operating system. Please follow this support article to find your correct location.
I also defined some additional labels (like server and a job name) to filter the logs later in Grafana.
Pipeline Stages
Use the following regular expression to parse the timestamp and separate them from the rest of the content.
"^(?s)(?P<time>\\w+ \\d+, \\d+ \\d+:\\d+:\\d+\\.\\d+?) (?P<content>.*)$"
Then define the timestamp format:
"Jan 02, 2006 15:04:05.000"
And since the log file doesn’t contain a time zone we specify them manually:
For me it’s "Europe/Berlin"
For more details check out the Documentation of Promtail regarding the timestamp.
As last stage we define the new content block (parsed from the regex).
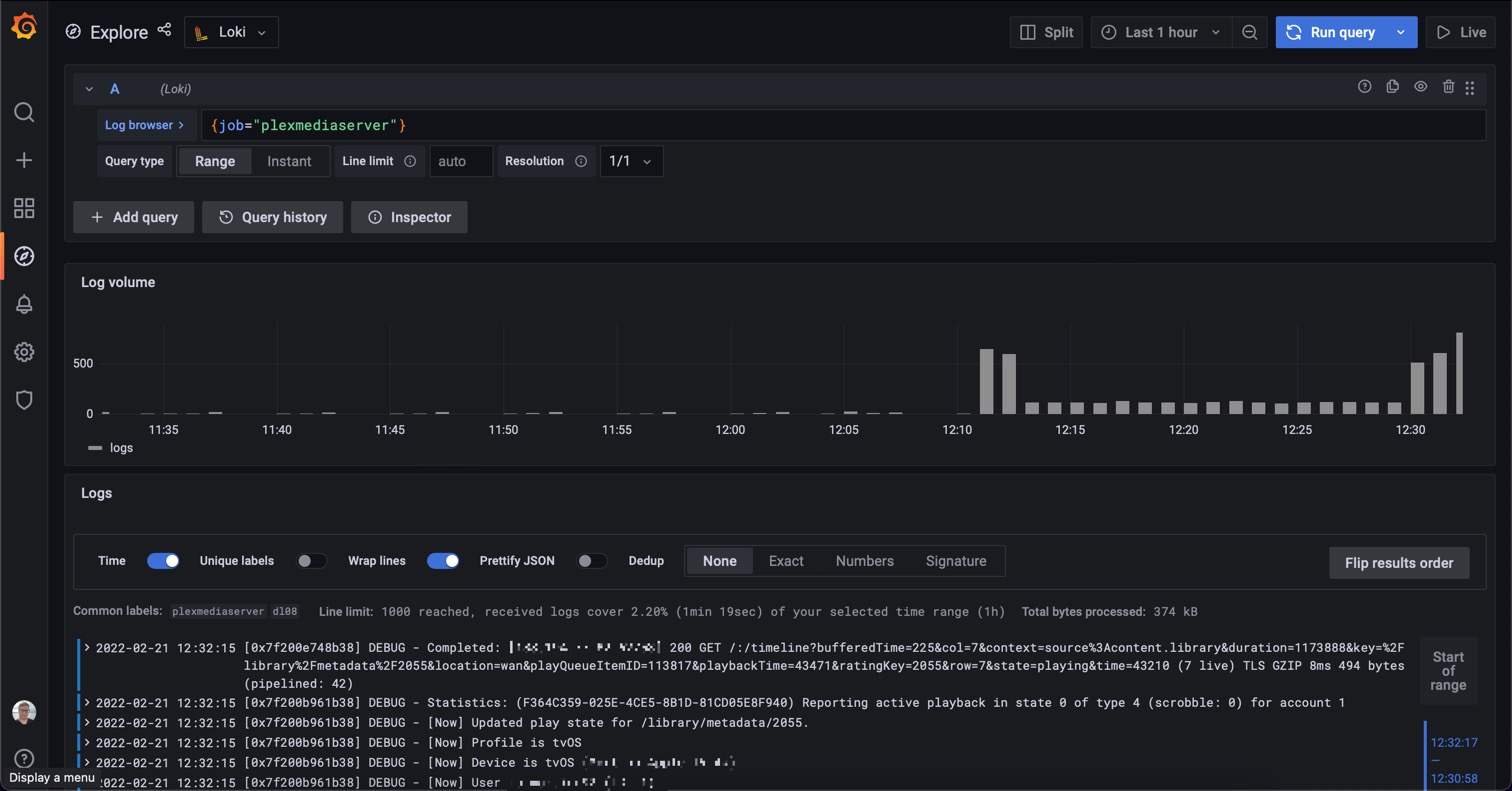
Grafana
Now we can create dashboards and alerts based on this data. Or we can simply read the logs using the Explore section of Grafana: